In planning for the future, public companies often take for granted an assumed range of anticipated steady stock price appreciation broadly in line with the cost of equity. The reality is that more often than not companies do not realize returns within this range.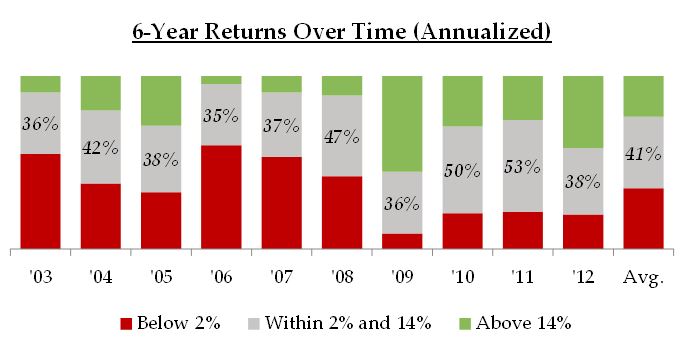
What have we shown? A company’s total return performance often falls outside of a broad range centered around its cost of equity. Surprisingly, over a 6-year time period (both the average length of an economic cycle and the average CEO tenure) the odds of producing a compounded annual (i.e. annualized) total equity return within a broad range of 2% to 14% are less than 50%, essentially a coin toss.
Why is this important? This observation suggests that, at a given point in time, a company is likely substantially undervalued or overvalued as measured by the market. Alternatively, it suggests that a company has been affected by a recent event that would result in a change in its intrinsic valuation (e.g. loss of a major customer, lawsuit, large contract win) and such high impact events should not be viewed as a rarity but rather a very commonplace occurrence. Since the optimal strategic, financial, and capital allocation decisions a company makes are usually informed by its view of its valuation, blind reliance on market stock prices and anticipation of steady appreciation is as often likely to lead to suboptimal decisions as not.
What can (should) be done? The company’s management and board of directors should devote meaningful time and resources to evaluating the company’s current valuation and developing a framework to plan for the future. This should be based on divergent scenario analyses for the dispersion of possible outcomes.
The Capital Asset Pricing Model: The most commonly known and generally accepted theory for the pricing of securities is the capital asset pricing model, invented by William Sharpe and John Lintner. The basic premise of the capital asset pricing model (CAPM) is that investors demand compensation based on two factors: (1) the time value of money and (2) risk. The CAPM model calculates a company’s cost of equity as the risk-free rate plus a risk premium. For example, suppose Company A has a beta (measure of risk) of 1.5. Assuming a risk-free rate of 3% and market risk premium of 6%, Company A’s cost of equity would be 12%. Said differently, investors would expect an annualized return of 12% if they invested in Company A.
Ke = Rf + β*(Rm – Rf), where
Rf = risk-free rate
β = beta of the security
Rm = expected market return
In recent history, the calculated cost of equity for individual companies in the S&P 500 has averaged approximately 8%, with an average beta of 1 and a wide beta range of 0-2x. Given the market risk premium of 6%, as a rough estimate, CAPM would suggest individual companies in the S&P 500 ought to deliver annual returns in a range of 2-14% assuming an up and down sensitivity that is the size of the risk premium.
A Surprising Disconnect: But rarely does this happen for a given company. Over the last 15 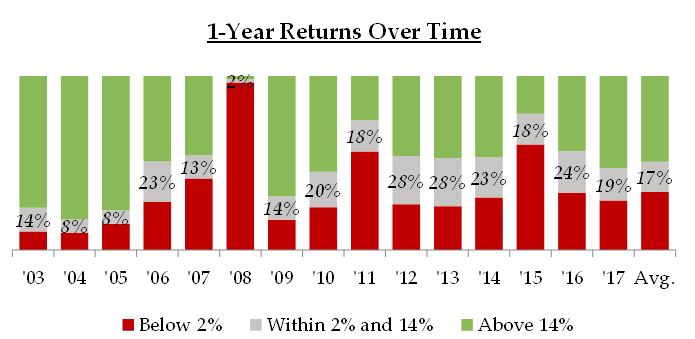 years, the proportion of companies in the S&P 500 that delivered a 1-year total return[1] of 2-14% has averaged only 17% as shown in the table to the right. This proportion has been as low as 2% (during the depths of the Financial Crisis) and as high as 28%. By contrast, the S&P 500 as an index has delivered annual total return of 2-14% nearly half of the time (in 7 of 15 years) during the same period.
A higher 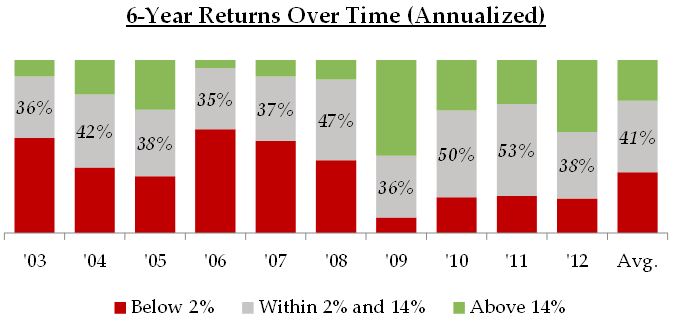 proportion of companies perform within this band when the time period is extended, but not by enough to alter the thesis. When the period is extended from one to 6 years (roughly the average public CEO tenure and length of an economic cycle), the proportion of companies delivering a 2-14% annualized return has averaged 41%. This proportion has been as high as 53% and as low as 35%. Thus, even over an extended period, delivering an expected total return in line with a broad cost of equity range is
  at best a coin toss.
A similar trend holds true when comparing individual company performance relative to the S&P 500. Since 2003, the proportion of companies in the S&P 500 that have delivered a 1-year total return[2] within 6% of the index itself has averaged just 18%. Similar to the absolute return data cited above, this ratio has been as low as 7% and as high as 26%.
Extending the tim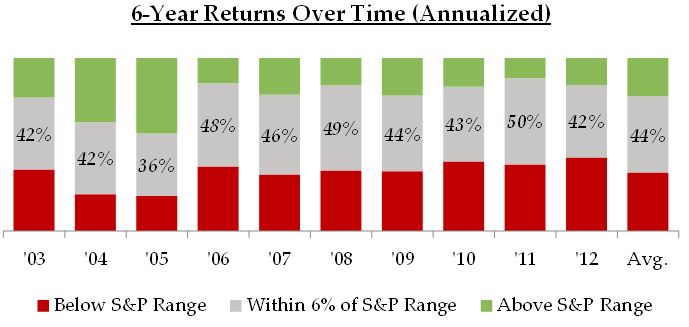 e period to 6 years shows a similar trend to the absolute return data. Over the extended period, the average proportion of companies beating or lagging the S&P 500 by less than 6 percentage points is 44%. The ratio has been as low as 36% and as high as 50%.
Implications: So what does this all mean and why should we care? Many companies make important decisions on the basis of an assumption that their stock price will appreciate roughly in line with their cost of equity plus or minus a broad range. However, the data cast considerable doubt on this assumption. In 50-65% of cases (depending on the time frame) a company’s stock price performs outside of a broad range centered around its cost of equity, suggesting either meaningful mispricing by the market (being undervalued or overvalued) or having experienced a fundamental change to the business valuation based on a major event. So, at any given point in time, it is more likely than not that the stock price will perform outside of the range expected by the cost of equity. This has important implications for corporate strategy and planning and presents potentially attractive value creation opportunities.
Corporate leadership teams should focus on developing an objective and thoughtful view of the company’s own intrinsic valuation and current trading relative to that value. They can then assess whether there are any specific changes in capital allocation to be made in response to current valuation and as a supplement to the organic business plan. As an example, if management is able to determine that the current stock price is undervalued, it may be worth considering a share repurchase program. If the converse is true, it might suggest capitalizing on the strength in the stock and issuing equity to pay down a heavy debt load or to use equity as currency in M&A transactions.
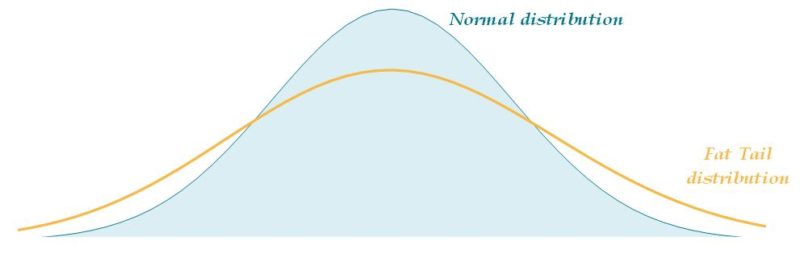
The fact that the base prediction for the future represented as the cost of equity has a meaningful probability of being incorrect points to the importance of using a framework that is based on scenario analyses to account for the dispersion of possible outcomes. Stock prices frequently diverge significantly from the present value of a company’s strategic plan or base case scenario, which we believe often receives inadequate sensitivity and scenario analysis. For stock price performance, the tails in the range of potential outcomes are “fatter” than what one would expect.
 A Differentiated Framework: At Foros, we believe that too much weight is placed on one scenario or “base case” in thinking about the world. Said differently, the tail outcomes are often ignored or underemphasized. Our Strategic Assessment offering addresses this shortcoming. In these engagements, we work with our clients to create a broad range of sensitized organic business plan scenarios, evaluate the value implications of the outcomes of these scenarios, and develop strategic action alternatives to create value beyond the organic plans. We welcome the opportunity to meet with management teams and boards to explain our approach.
- The data refer to companies in the S&P 500 as recorded at the start of that year. For example, the 2006 column in ‘1-Year Returns Over Time’ includes companies in the S&P 500 as of January 1st, 2006 and includes their respective total returns from January 1st, 2006 through December 31st, 2006.
- The data refer to companies in the S&P 500 as recorded at the start of that year and compares their respective total returns to a range defined as the index’s total return for that period ± 6%.