Executive Summary
Many private companies face a choice between an initial public offering (IPO) and a sale to a strategic acquirer as a means for founders and investors to capture and monetize the value they have created. Faced with this choice, many companies opt for the IPO even when a strategic acquirer offers to purchase the company at its anticipated IPO valuation. A key consideration is founder and investor belief that post-IPO appreciation in stock price results in a higher value over time. Our analysis of all U.S. Tech IPOs since 2002 indicates that, while the data vindicates this belief for IPOs during the period from 2002 to 2009, IPOs have underperformed the S&P 500 by approximately 10% on an annual basis for the period since 2009. Shareholders of these later vintage IPO companies would have been better off selling their companies at the IPO price and investing in broad market indices.
Description of Analysis and Summary Findings: Post-2009 IPOs Underperform
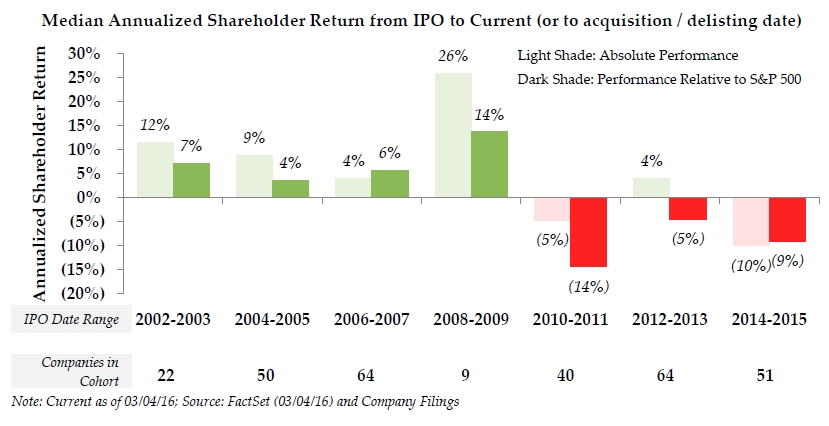
As the chart below shows, U.S. Tech companies that went public after the Dot-Com Bubble through 2009 have experienced market success, while U.S. Tech companies that went public after 2009 have underperformed, both on an absolute and relative basis. Our conclusion is based on an analysis of the annualized returns of all 300 U.S. Tech IPOs between 2002 and 2015(1).
Explanation for Findings: Premium Multiples for Growth Post-Great Recession
What might explain the differential in market performance between IPOs through 2009 and IPOs after 2009? One hypothesis is that U.S. Tech companies that went public before the end of 2009 have had sufficient time to grow and realize the benefits of scale, while companies that went public after 2009 have not reached maturity and are more susceptible to volatile market performance in their early years. However, further analysis indicates that enhanced maturity is likely not the explanation. If the post-2009 IPO companies were being affected by lack of scale and maturity, we would expect to see a significant size differential between the two groups of companies. However, the median current market cap and median revenue for companies with IPOs after 2009 (approximately $550mm and $250mm, respectively) are not substantially lower than the respective medians for companies with IPOs before the end of 2009 (approximately $600mm and $325mm). Additionally, the size of the company upon going public does not appear to have any bearing on future market performance, as IPOs before 2009 had approximately $100mm in annual revenue at the time of IPO, compared to approximately $120mm for post-2009 IPOs.
Our hypothesis is that the differential in market performance results from a readier embrace of IPOs by public company investors during the 2010-2015 period. Companies that go public at lower valuation levels have more room to increase shareholder value, while companies that go public at higher valuation levels have potentially limited further upside. In the aftermath of the burst of the Dot-Com Bubble, public company investors, burnt by their then-recent experience, showed greater scrutiny of IPO valuation levels. By contrast, following the Great Recession when growth became scarce in all segments of the economy, investors showed greater hunger for companies with strong growth prospects. This allowed high-growth U.S. Tech companies to go public at more ambitious valuations.
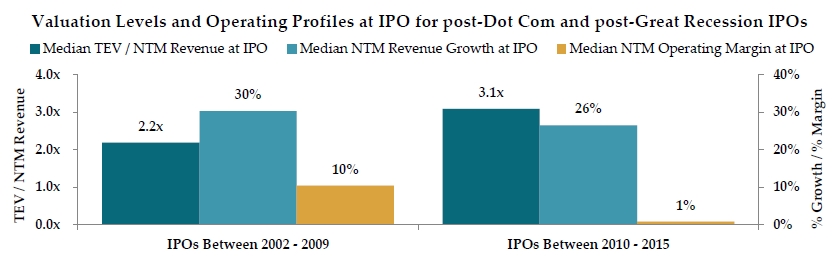
As the chart below shows, the median Enterprise Value to Revenue multiple at the IPO price has increased by nearly a full turn when comparing IPOs through 2009 to IPOs after 2009. This multiple differential is likely attributable to a change in investor appetite as the revenue growth and operating margin profiles for post-2009 IPOs are actually slightly less favorable than those of IPOs before the end of 2009. When revenue growth slows or revenue growth fails to translate into earnings growth for more recent vintage IPO companies the market performance of these companies is disproportionately affected to the downside because they have more distance to fall.
Summary Implications: Consider Sale Over IPO
Absent other considerations, a private U.S. Tech company with an opportunity for a sale ahead of an IPO at a valuation at or near the IPO price should consider choosing the concrete sale option over the potentially uncertain prospect for post-IPO value appreciation. Many private company boards believe that their companies will be top IPO performers. However, a private company board choosing an IPO over a sale would have to convince itself that its company’s market performance will not regress to the mean. The IPO performance data in recent years is sobering in this regard.
Based on the summary findings, strategic acquirers might be tempted to bet on post-IPO underperformance by US Tech companies and therefore wait before proposing an acquisition. However the wait might not be warranted; the acquisition price, which would include a premium to the then-lower public company trading price, could easily be higher than the IPO valuation.
In summary, we would encourage private companies to be more open to evaluating and pursuing a sale outcome at their anticipated IPO valuation instead of pressing forward with an IPO. We would also encourage strategic acquirers to be more receptive to acquiring companies at those valuation levels.
Footnotes:
(1) Annualized returns represent the Compound Annual Growth Rate (“CAGR”) of a company’s total shareholder return. Total shareholder return is the sum of stock price appreciation and dividends. The company’s performance is measured from the IPO date through either i) March 4 th, 2016 if the company is still public, ii) the last trading trade if the company was acquired subsequent to its IPO, or iii) the delisting date if the company went bankrupt. The return performance is measured from the IPO price, as opposed to the first day close price. A company’s relative performance is based on overperformance/(underperformance) of the total return of the S&P 500 index. The analysis aggregates IPOs over two-year periods to ensure a sufficient sample size for each cohort. The data set is limited to technology companies, as defined by FactSet, that are headquartered in the U.S. and listed on a U.S. Stock Exchange. Companies that relisted after being taken private are excluded as we believe they are not representative initial public offerings. Excluded companies are CDW, Freescale, First Data, IMS Health, and Sabre.