Companies routinely use leveraged recaps to boost shareholder returns. The idea is simple: recapitalize the company by increasing debt and using the proceeds to reduce the overall equity such that a smaller group of shareholders participates in the company’s future upside with an improved return profile. The math for improving returns is also simple: substitute cheaper debt for expensive equity. Given the continued low interest rate environment, companies have pursued share repurchase programs aggressively in recent years, often funded with new debt.
This basic analysis demonstrating enhanced shareholder returns from a leveraged recap overlooks two key points. First, the analysis frequently ignores the resulting greater financial and balance sheet risk and corresponding increase in stock price volatility. The core concept that the potential for greater reward comes with an increase in current risk must be acknowledged. To quantify that risk: in a hypothetical illustrative scenario below, a leveraged recap leads to an increase in beta – a measure of volatility for equity – from 1.7 to 2.2. Second, the analysis is only from the perspective of a shareholder that remains with the company and fails to account for the shareholders who are bought out. In fact, while a leveraged recap improves potential headline annual returns from 14% to 18% for remaining shareholders, if returns for all shareholders are considered, the incremental benefit is roughly halved and drops to 16% as shown in the hypothetical scenario below. In short, a leveraged recap generates upside when things go according to plan, but there is downside risk, and returns are not exactly as they may appear. We encourage managements and Boards to focus on these two overlooked points and to insist on a quantification of risk and analysis of benefit to all shareholders prior to approving a leveraged recap.
Exhibit 1 below summarizes the key assumptions used in the hypothetical scenario to demonstrate these points. Exhibits 2, 3 and 4 provide greater supporting detail for the analyses.
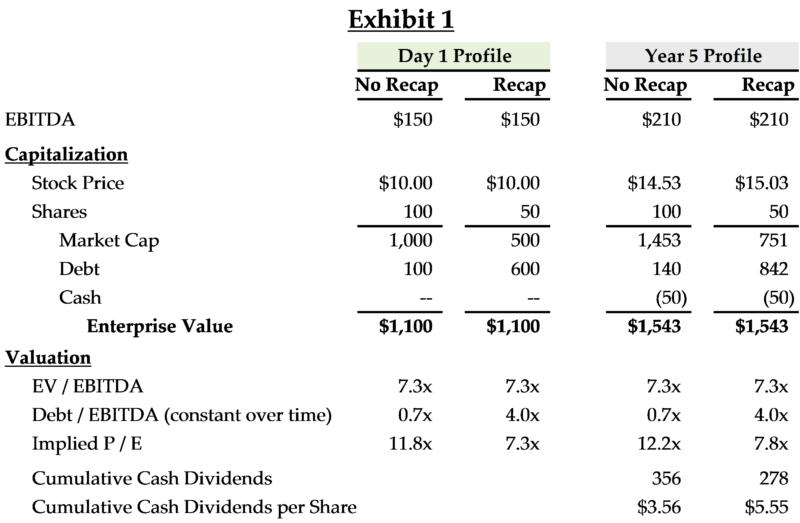
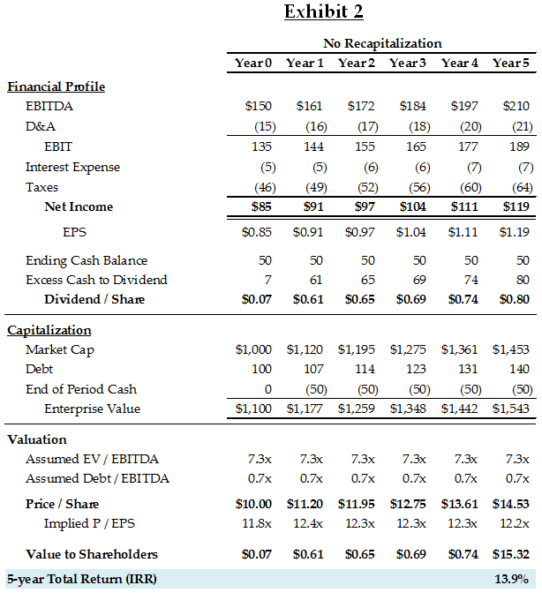
In Exhibit 2, we assume a company has $150 million of EBITDA in Year 0 that grows 7% annually, with 5% interest expense and a 35% tax rate. We also assume the EBITDA multiple remains constant at 7.3x and the leverage multiple remains constant at 0.7x. There is a minimum cash balance requirement of $50 million, and all excess cash generated is paid in the form of dividends to shareholders. Assuming 100 million shares outstanding, we calculate the total return including dividends, as an internal rate of return (IRR), over a 5 year period to be 13.9%. The P/E multiple in year 5 is higher than year 0 as market cap has increased relative to enterprise value.
If the company engages in a leveraged recapitalization with the assumptions shown in Exhibit 3 on the following page, returns improve for remaining shareholders. In Exhibit 3, we assume $500 million of incremental debt and no further changes to the EBITDA profile, interest rate, or tax rate. We assume the Company maintains its 7.3x EV/EBITDA multiple and keeps a constant 4.0x leverage ratio throughout the forecast period. There is a minimum cash balance of $50 million and all the excess cash generated is paid in the form of dividends to shareholders. Assuming 50 million shares following the recapitalization and a constant cost of debt at 5%, the IRR for remaining shareholders is 17.8% over a 5 year period.
The growth in enterprise value is the same in both cases while the stock price increases at a higher rate as the recapitalization reduces the amount of equity capital by substituting lower cost debt capital. At the same time, the P/E multiple is lower in the recapitalization scenario as there is more debt (or less net cash) on the balance sheet.
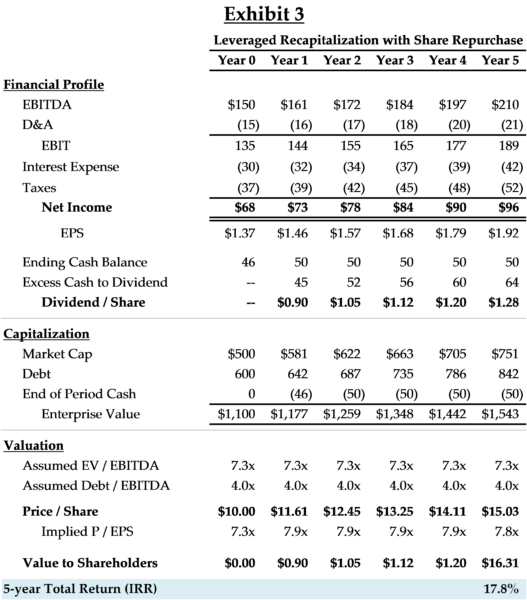
The lower P/E in Exhibit 3 as compared to Exhibit 2 can be partly explained by the increased cost of equity that accompanies increased leverage. As debt and interest expense increase, earnings volatility also increases – a leveraged recapitalization enhances return but also amplifies risk. This risk is usually quantified through an observed beta. In an efficient market, a P/E ratio equals (1- r) / (κ -g)[1] and as κ goes up, the P/E ratio goes down. In year 5, the revised P/E ratio in Exhibit 3 of 7.8x compared to Exhibit 2 at 12.2x implies an increase in cost of equity from 12.5% to 15.6%, and an increase in the beta from 1.7 to 2.2. [2]
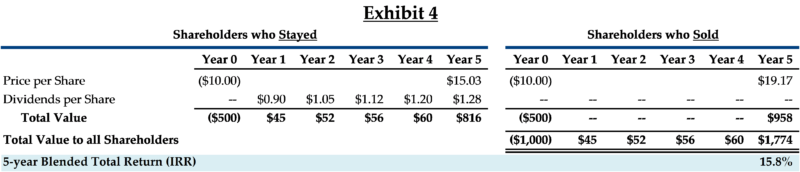
The blended IRR for both sets of shareholders, those who sold and those who remain, is shown in Exhibit 4. This assumes that selling shareholders are able to earn the same return of 13.9% elsewhere, as shown in Exhibit 2 for the same 5 years period. The shareholders who sold do not participate in the upside or the risks associated with the company. If the company considers the blended return of 15.8% while weighing the risk of the leveraged recap, as opposed to the 17.8% return, conclusions relating to the method of capital return may be different.
Engaging in leveraged recapitalizations can be beneficial under certain circumstances, but the benefit is not as large as is often claimed. If there is a leveraged recapitalization and stock is repurchased with debt, this will be value creative as long as the cost of the debt is less than the cost of repurchasing equity. However, total enterprise value will only change if the company’s financial profile or trading multiples change. Management teams should focus on risks to continuing shareholders and total shareholder value, not just share price, and Boards should insist on reviewing the full blended analysis.
[1] r is the plowback ratio, κ is the cost of equity and g is the expected steady state growth rate.
[2] Based on CAPM, defined as risk free rate + (Beta * Market Risk Premium). Using a 2.5% risk-free rate based on the 1-month average U.S. 20-year treasury yield as of 09/26/17, a 6.0% market risk premium per Ibbotson.
Annex A – Capital Structure and Capital Return Theory
The concepts of cost of capital and return on capital are often used as tools to evaluate options to improve share price. Along these lines, the most common questions that management teams consider include:
- What is the cost of capital (equity and debt)?
- What is the optimal amount of leverage? Can cost of capital be lowered by adding leverage?
- How should capital be allocated or deployed?
- How does reinvestment compare with returning capital to shareholders?
- Is organic reinvestment better than acquisitions?
- If capital return is more attractive, are share repurchases preferable to dividends?
Cost of capital is a function of many company specific variables including earnings profile, growth, size, leverage, diversity, and volatility among others. In addition, sector performance, market dynamics and macroeconomic conditions also influence the cost of capital. There is a large amount of literature available on calculating the cost of capital as well as understanding the optimal amount of leverage. Miller and Modigliani have famously theorized that value cannot be created by changing the capital structure. That is, a firm and its cost of capital depend entirely on the real assets that the firm owns, and the firm’s financial capital structure cannot ever impact the market value of those real assets.
Most observers and practitioners agree that each company has an optimal capital structure and increasing leverage until that point is beneficial despite its potential impact on the cost of equity. Management teams often believe that shareholder return can be enhanced through issuing debt. The idea is to place a ‘leveraged bet’ on the financial performance of the company, assuming that the increase in shareholder value exceeds the adverse impact of the interest cost burden and increased risk generated by the additional debt. At a certain point issuing incremental debt becomes more costly than the return that additional capital can generate.
If a management team has concluded that its company is under-leveraged and issuing additional debt is beneficial, it has to then decide upon the best place to deploy the proceeds received from issuing debt. If returning capital to shareholders is preferable compared to reinvesting it in the business, or hoarding it on the balance sheet, the choice is between paying a regular dividend, paying a special dividend or repurchasing shares.
Regular dividends make sense for companies with stable cash flows as they help establish a floor price, signal expectations of consistent cash flow and attract value investors. However, from a management team’s perspective once a regular dividend has been set it becomes inflexible and from a shareholder’s perspective dividends have a more adverse tax impact in the short-term. On the other hand, repurchases allow management to have flexibility because they can be modified opportunistically and also provide a signal that a stock is undervalued. Additionally, repurchases help counter earnings and ownership dilution from equity compensation plans. In most cases, companies with a more mature financial profile and outlook opt for regular dividends as compared to younger or more volatile companies, while special dividends tend to be event driven.
As companies evaluate repurchases, they too often think in terms of driving up the stock price as opposed to increasing the value of the enterprise as a whole. Theoretically, if the cost of debt is lower than the cost of equity, then increasing leverage and repurchasing shares (that is replacing equity with debt) would always drive the stock price up. Additionally, there is a tax benefit since the cost of interest paid on debt is tax deductible. However, assuming no change in financial profile or trading multiples, the increase in price is often only for the benefit of the shareholders that don’t sell their shares.