At the end of 2020, investment bankers and the financial press declared 2020 a good year for M&A citing several headline-grabbing megadeals and the $1 trillion volume mark overall in U.S. M&A[1]. The favorable commentary continued after the first quarter of 2021, which some declared the greatest quarter for M&A in the 21st century. But adjust these headline numbers for two key factors – SPACs and the relationship to the overall value of U.S. companies, and on that relative basis, 2020 was the worst year of the century for U.S. M&A and Q1 2021 is well below recent historical averages.
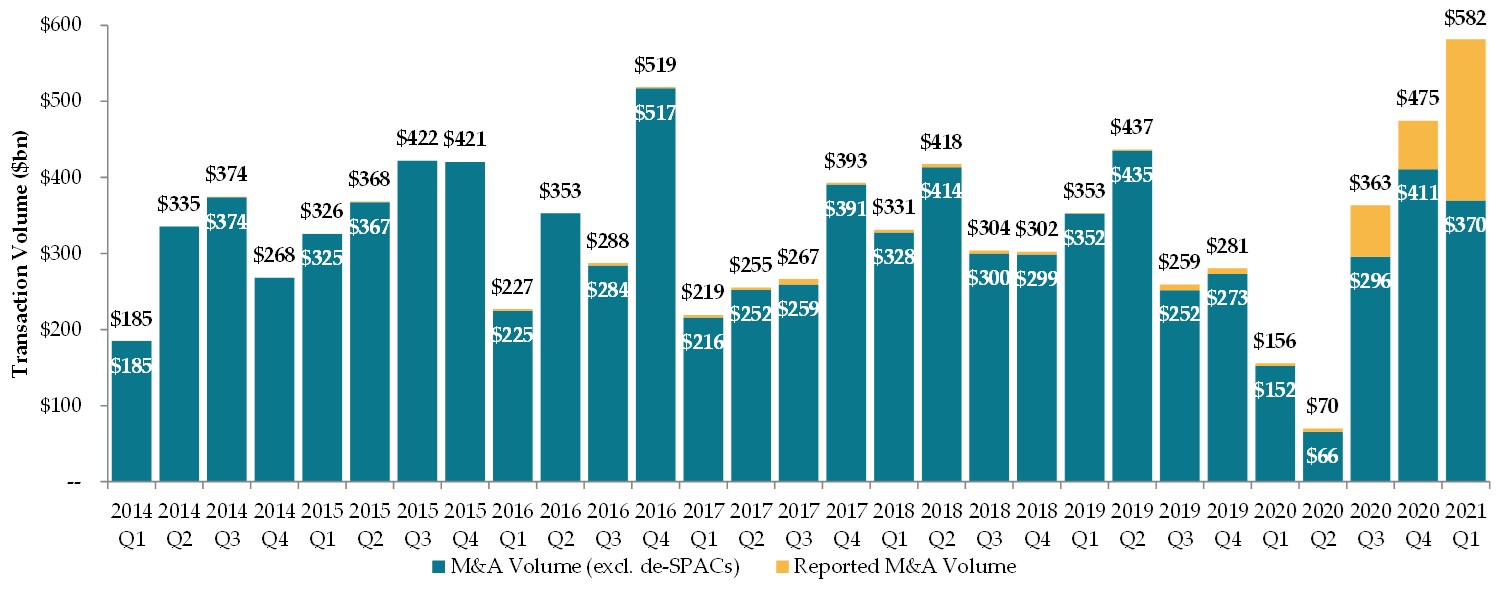
First, the reported M&A data includes transactions with SPACs, or special-purpose acquisition companies. While technically transactions involving SPACs fall under the M&A umbrella, practically speaking they are a vehicle for companies to go public, essentially as an alternate to the more traditional IPO. There was a record volume of de-SPAC transactions in 2020, eclipsing the total volume of de-SPAC transactions over the prior 20 years combined, and the trend continued into the first quarter of 2021, with 2021 volume already exceeding the 2020 total. By including these transactions in the calculation of total M&A volume, the headline number is being fundamentally overstated. When adjusted for this in the graph below, it is clear that the first quarter of 2021 – while certainly strong – was far from the best quarter in history, let alone since 2014, when U.S. M&A began to exceed $1 trillion annually.
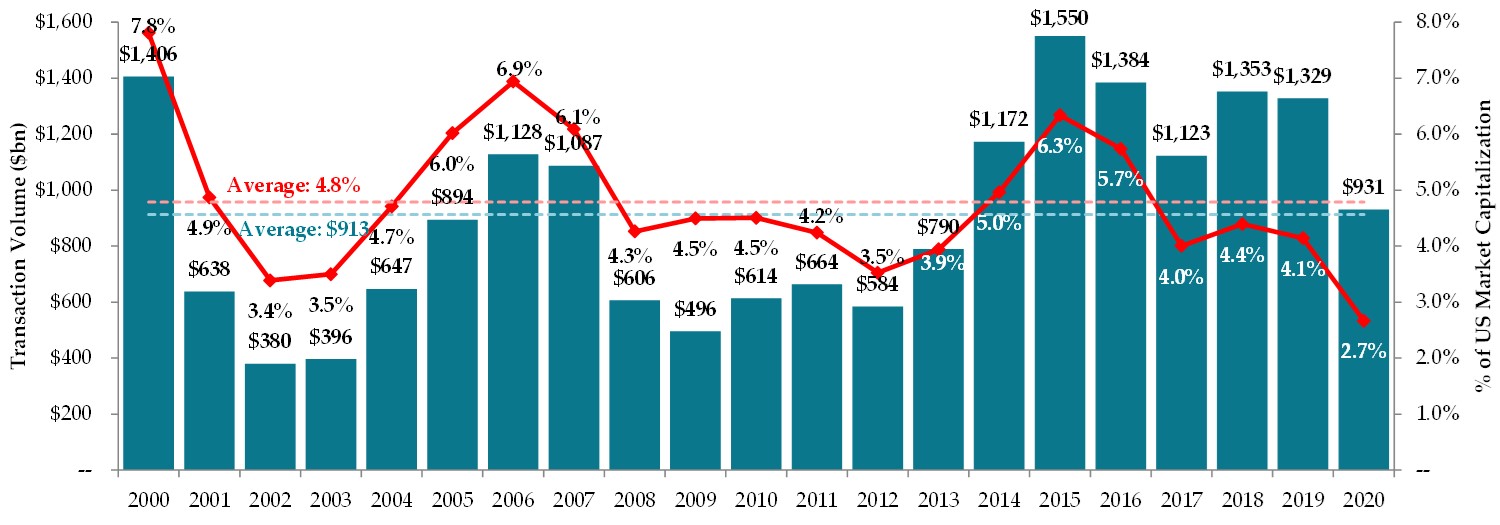
Second, M&A activity needs to be put in context of the total value of U.S. companies. Company values have increased dramatically over the years; therefore, one trillion dollars of M&A volume represents a far lower share of that value today than it did say ten or twenty years ago. Using U.S. equity market capitalization as a proxy for value of U.S. companies, the first chart below shows annual U.S. transaction dollar volume and the dollar volume relative to the value of U.S. companies[2]. While 2020 M&A volume was slightly above the 20-year average, the true measure of M&A strength – as a function of the overall economic value of U.S. corporations – was at its lowest point in 2020.
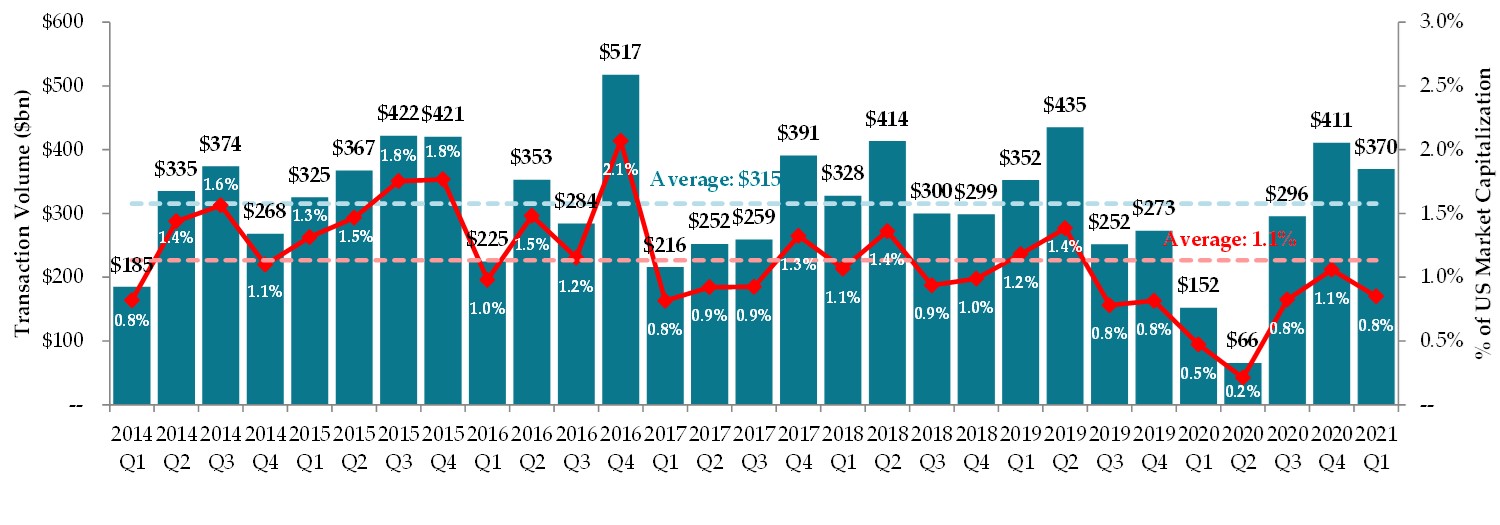
The underperformance carries into Q1 2021 as shown below, which looks at quarterly volume since the start of the recent U.S. M&A bull market (in dollar terms) beginning in 2014. This clearly shows that M&A deal volume has failed to keep pace with the substantial increase in valuation.
Despite headlines to the contrary, the historically soft 2020 U.S. M&A market should not come as a surprise. While M&A has certainly recovered since the lows from Q2 2020, we previously articulated the reasons for market softness in our summer 2020 Foros Perspective: against the backdrop of recovering equity markets and strengthening credit markets, we hypothesized continued weakness in the M&A market.
Today, in spite of even stronger capital markets, we continue to believe that this is a difficult environment for deal-making. Specifically, the abundance of cheap capital and elevated market multiples, we believe, pose — perversely — major obstacles to M&A activity. As we have indicated before, most deals happen out of eagerness to capitalize on a major opportunity or a desire to mitigate a substantial downside risk. In an environment of elevated valuations and abundant credit, most buyers will struggle to find bargains and most sellers will not feel pressured to sell.
[1] Notable press includes the FT’s 12/31/20 article M&A rebounds sharply to hit $3.6tn in 2020 and Bloomberg’s 12/20/20 piece titled M&A Deals Come Roaring Back as Executives Plot Post-Covid Future.
[2] Transaction volume reflects announced transactions in any given year with U.S. headquartered companies as the target. The denominator (U.S. market capitalization) reflects the average annual sum of the equity value of all U.S. headquartered companies listed on U.S. exchanges.
Source: FactSet (04/01/2021)